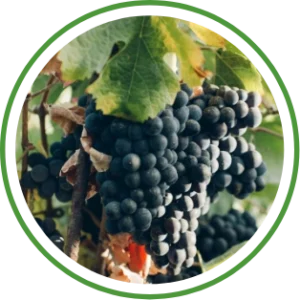
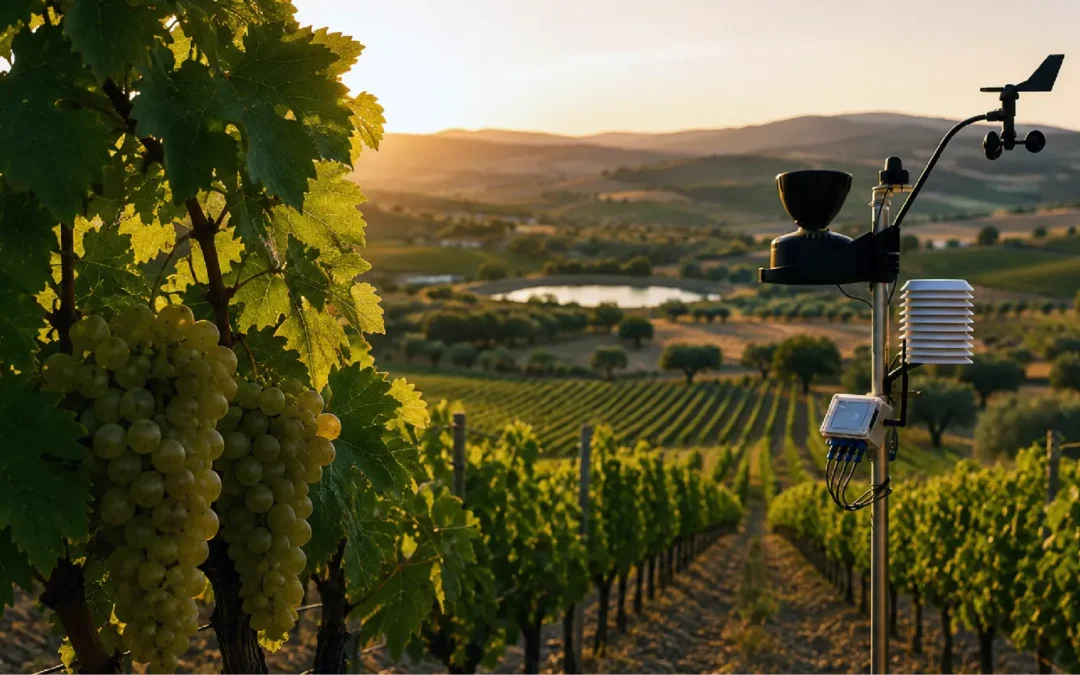
On August 6, the first white grapes from Rioja Oriental arrived at the winery: the earliest harvest on record in the history of the DOCa. This is not an isolated case. In several regions of the country, the harvest has begun more than twenty days earlier than usual, and the harvest calendar in Spain has shifted by ten to fifteen days over the past two decades.
What matters is not the record itself, but the fact that the record is being broken again. This early onset is no longer a weather anomaly—it is a structural condition. And what is lost as a result is not just a date, but the ability to plan.
A compressed cycle is not a normal cycle run earlier
The heat accelerates the accumulation of sugars and the decline in acidity faster than phenolic ripening progresses. The decision window is narrowing: waiting for polyphenols may cost degrees; acting too soon to preserve freshness may cost tannins. This growing season, the Regulatory Council’s bulletins have reported a delay in alcoholic ripening parameters compared to 2025, despite the early start, and an average berry weight below last year’s for most varieties.
Added to this is the issue of heterogeneity. Altitude, orientation, soil, and water availability create very different growth patterns within the same farm, and a compressed growing cycle amplifies those differences: two plots separated by three hundred meters may require a one-week difference in harvest date.
The regional average does not apply to your plot
A regional bulletin indicates a trend. A public weather station 15 kilometers away, at a different elevation, can show a difference of several degree-days over the course of the cycle. When the margin of error narrows, the only way to reduce it is to measure where the decision is made: on the plot itself, continuously, and with sufficient historical data for comparison.
What Cesens Offers
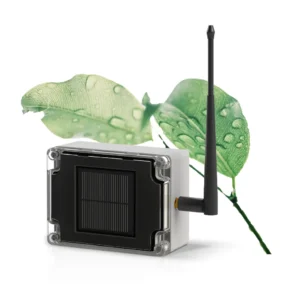
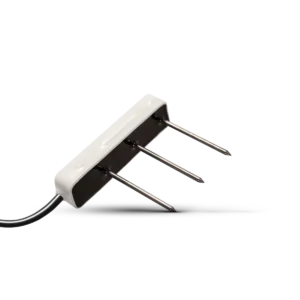
- Real-timedata specific to each plot: temperature, humidity, precipitation, radiation, leaf moisture, and soil water content.
- Comparison with previous growing seasons: quantify the advance in cumulative heat units, rather than relying on intuition.
- Hydrological and phenological status, to anticipate ripening delays during extreme summers.
- Infection risk models fed with local data, whose time windows also shift with the crop cycle.
- Threshold-based alerts and automatic reports, to monitor multiple plots without having to constantly watch the screen.
The campaign that is ending is the data for the next one
Each early vintage adds another series to the evidence of the shift, but that series only exists if someone has measured it.
The end of the harvest is the best time to install: the next campaign then starts with a full baseline from the winter break.