Decision making on irrigation management is an essential part of good management practice for any crop and often plays a vital role in optimizing productivity and profitability. Improper scheduling of irrigation results in the waste or underutilization of water resources through insufficient or excessive irrigation and the most accurate irrigation practices involve applying the right amount of water at the right time.
The Producers and irrigation specialists currently have many information resources, including historical water records, networks of regional or own meteorological stations that allow us to make decisions which are adapted to our cultivation to estimate the meteorological and water demand through telemetry.
In this article we will see the advantages and disadvantages of the most frequent irrigation scheduling system used by farmers, which is mainly based on reference evapotranspiration (ET0). At the same time, we make a comparison with more modern and precise systems using soil moisture sensors with telemetry.
Irrigation management is often done based on soil water balance (Figure 1). The process in which water is transferred to the atmosphere from the leaves and from the soil surface is called evapotranspiration (ET), which is the combination of evaporation from the soil and transpiration from the plant. Plants absorb water in the process of transpiration. The water is transferred to the atmosphere from the surface of its leaves, the larger the surface of the leaves, the greater the rate of absorption and transfer of water to the atmosphere.
Reference Evapotranspiration (ET0) Method
The reference evapotranspiration (ET0) is defined as the evapotranspiration of common grass or in some cases of alfalfa (ETr). These ETo data are normally supplied by regional meteorological stations. Most of these stations calculate ETo using the FAO Penman-Monteith method (Allen, 1998). This method is based on the climatic data of temperature, relative humidity, pressure, and solar radiation, to calculate a series of very complex metrics that provides a certain amount of reference evapotranspiration ETo. In some regional stations ETo is also estimated using a standard evaporation tray or with the use of lysimeters that measure the evaporation rate of water.
Once the ETo is obtained, the crop evapotranspiration (ETc) can be calculated. ETc is, in most cases, lower than ETo because the plant does not cover the entire soil surface. Therefore, the ETc for a specific crop generally increases as it grows. ETc is calculated by multiplying ETo by a specific crop coefficient (Kc) (equation 1) that corresponds to the phenological phase or the growth state of the crop, considering the surface occupied by its leaves and its water needs in the specific growth phase. To calculate the ETc and determine the irrigation demand, the following equation is used:
ETc = ET0 x Kc (1)
Once the ETo is obtained, the coefficient of the desired crop is used to obtain the amount of irrigation demand. The following table shows some of the crop coefficients (Kc) with their respective growth stages for the most common crops in La Rioja, Spain. (These indices are averages, for greater precision consult studies of specific varieties of crops).

![]()
Table 1. Crop coefficients (Kc) for the most common crops in La Rioja, Spain (A). Development of the coefficients of the crops during their phenological stage.
One of the most common problems within the world of farmers is that in many cases they directly use ETo data to replace the soil moisture lost by the evapotranspiration of the plant, without considering the coefficient of the crop or the growth stage of the crop, either for simplicity or not knowing how to incorporate the coefficients of specific crops. This leads to amounts of irrigation that are usually higher than what is necessary for the crop.
The ETc method, despite being widely spread, has the following disadvantages for irrigation scheduling:
• Many farmers use ETo directly without incorporating the crop coefficient.
• The use of ETc is not an irrigation based on the real state of soil moisture and useful water for irrigation but is an estimate based on the climatic conditions and predestined characteristics of a crop that assumes that it has all the favorable conditions.
• Regional stations where a lot of agricultural meteorology data are collected, including ETo, are a valuable source of information, but even the most dense stations leave large tracts of land without coverage, limiting the data usage if farms are far from regional station.
• In addition, local conditions on farms can vary significantly from those at the monitoring site, leading some farmers to install their own weather stations on farms.
• Another challenge is the need for a homogeneous and well-watered surface with favorable conditions, which ensures surface conditions that are representatives of the reference ETo.
• The actual Kc of the crop varies depending on the vegetation, it will fluctuate little by little, hence the reference values will serve as a better approximation, but it will rarely coincide with the real value.
• Therefore, the use of the ETo method is an estimate and not an accurate measurement of the water demand of a crop.
Soil moisture sensors
The next method is to balance the moisture content of the soil and the amount of water lost in the soil by the transpiration from plant leaves and by evaporation from the soil surface.
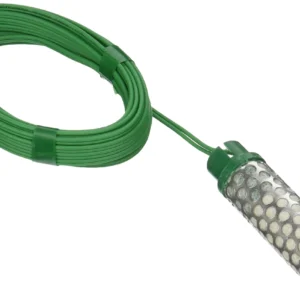
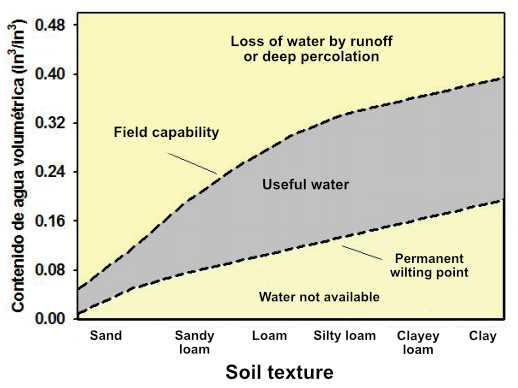
This method requires soil moisture sensors to directly measure the amount of water the crop is consuming. It is also necessary to have a knowledge of the type of soil, and its water retention capacity since soil is the medium in which water is stored. The amount of water that each type of soil can contain varies because each soil has a different particle size distribution and different sizes of pores where they are usually filled with air or water. For example, sandy soils tend to contain less water than clay soils due to their low retention capacity (see Figure 1).
Depending on the texture, a certain amount of water is strongly retained within small pores and cannot be extracted by the plant. Therefore, the “useful water” must be considered for each type of soil (Figure 1).
Soil water content is usually conventionally measured on a gravimetric (g / kg) or volumetric (m3 / m3) basis. Soil moisture sensors measure the water available to the plant based on the volumetric water content of the soil, whose behavior can be observed in Figure 1. The great difference between a sandy soil and a clay soil can also be observed. Sandy soils have a low capacity to store useful water, whereas a silty loam soil has a much higher capacity. At the upper end of the range of useful water in the graph we have what we call the “field capacity (CC)” of the soil and it is typically defined as the moisture content two to three days after a rain or an irrigation event has ended, in which excess water has been drained. At the lower end, the permanent wilting point (PMP) of a soil is the value at the lower moisture threshold beyond which a plant can no longer absorb moisture from the soil that is found in low quantities and strongly retained in the soil. This data is used to determine useful water in the soil and is given as a fraction of the soil volume.
The total amount of water available for absorption by the plant is the “useful water” (AU) which is the difference between CC and PMP (Figure 1):
AU=CC-PMP
and is often expressed as a percentage by volume (volume of water m3 / volume of soil sample m3). For example, a value of 0.2 m3 / m3 means that when the soil is saturated, the amount of useful water is equal to 20% of the volume of the soil. The “available water retention capacity” (CRAD) is determined by multiplying the AU with the depth of the root zone where the extraction of water occurs, which is often the first surface layer of the soil, that is:
CRAD=AU*(root depth)
Decreasing the water content to the PMP adversely affects the health and performance of the plant. Therefore, for irrigation purposes, a “maximum allowable reduction (RMP)” or fraction of the CRAD that represents the “available water (AD)” for the plant should be determined, AD is the ideal operating range of soil water content for irrigation planning. The value of AD is usually estimated by dividing the AU in half, that is:
AD=AU*0.5
Some values that can be used to estimate the AU of a certain type of soil are found in Table 2. These values comprise the average of the range for each type of soil. If the soil type has not been analyzed in a laboratory, the soil texture could be estimated using the soil touch texture technique (Mery, 1980).
Table 2: Moisture percentages as a function of soil texture (Adapted from Saxton and Rawls 2006).
| Texture | Field Capacity (CC) | Permanent wilting point (PPM) | Useful water (AU) |
| (%VWC) | (%VWC) | (%VWC) | |
|
Sand |
10 |
5 |
5 |
|
Loamy-Sand |
12 |
5 |
7 |
|
Sandy-Loam |
18 |
8 |
10 |
|
Sandy-Clay-Loam |
27 |
17 |
10 |
|
Loam |
28 |
14 |
14 |
|
Sandy-Clay |
36 |
25 |
11 |
|
Silt-Loam |
31 |
11 |
20 |
|
Silt |
30 |
6 |
24 |
|
Clay-Loam |
36 |
22 |
14 |
|
Silty-Clay-Loam |
38 |
22 |
16 |
|
Silty-Clay |
41 |
27 |
14 |
|
Clay |
42 |
30 |
12 |
Theoretically, irrigation scheduling consists of starting irrigation at low soil water content, corresponding to the given RMP, and irrigating until the eliminated water has been replaced without exceeding the CC, otherwise, a loss of water would occur due to runoff or deep drain. This procedure can be achieved in an automated way by means of soil moisture sensors using real-time telemetry. Additionally, once the soil moisture sensors have been calibrated with the soils where they will be installed, accuracy can reach as low as 2% error, resulting in very accurate soil moisture and irrigation rates.
CONCLUSIONS
Irrigation scheduling is generally set by the decision of the agricultural producer in most cases, or by using a predetermined schedule of irrigation schedules based on water needs using historical data or those published in FAO 56 (Allen, 1998) mentioned previously. In order to establish an adequate irrigation schedule, several factors are taken into account, such as: the evapotranspiration capacity of the crop, the characteristics of the soil type and the distribution or depth of the roots.
By having soil moisture data in real time, on a network of sensors with telemetry at each station, farmers are moving away from the world of estimating evapotranspiration and towards a world of accurate measurement of soil moisture. By being able to quickly determine the actual soil moisture level and water holding capacity for each station, and then setting precise humidity targets to make irrigation scheduling more efficient in response to that precise data, farmers go from complexity to simplicity.
Table 3: Comparative summary of the use of the ETc evapotranspiration methodology and the methodology using soil moisture sensors.
|
Type of method for calculating irrigation |
||
|
Evapotranspiration (ETc) |
Soil moisture sensor |
|
| Coverage area |
By zones |
By type of soil or areas |
| Types of soil |
Generic |
Specific |
| Maintenance | Half | Low |
| Irrigation precision | Low | High |
| Cost/Investment | Low |
Half |
| For specific crop |
Si |
Si |
| Irrigation excess |
Si |
No |
| Water/ energy savings |
Half |
High |
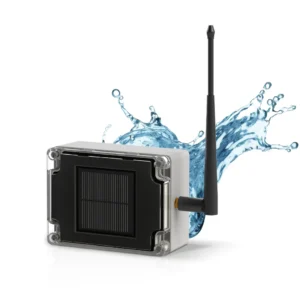
Meteorological irrigation stations using soil moisture sensors facilitate irrigation improvement by providing detailed information on the actual water demand for crops. This is what Encore Lab calls smart watering. Due to this, the monitoring of the water status of the plants and the soil can be used in addition to schedule irrigation.
New advances in mapping water demand of the crops, will depend on new technologies and measurement methods. For these measurements to be useful to producers, they must be affordable, accessible, and compatible with existing irrigation systems and agricultural practices. Site-specific real-time soil moisture data provides accurate information to support irrigation scheduling, facilitating optimal allocation decisions, mitigating the risks of crop loss, and improving overall efficiency of irrigation.
References:
- Allen, R.G., Pereira, L.S., Raes, D., and Smith, M. 1998. Crop evapotranspiration – Guidelines for computing crop water requirements – FAO Irrigation and drainage paper 56. Food and Agriculture Organization of the United Nations, Rome, Italy: FAO.
- Saxton KE. y Rawls W.J. (2006). Estimaciones características del agua del suelo por textura y materia orgánica para soluciones hidrológicas. Soil Science Society of America Journal. 70: 1569-1578.
- Mery, R. (1980) Determinación manual de la textura de suelos mediante la técnica del “tacto”.